.png)

_logo%201.svg)


AI Summary
Introduction
At Kili, we believe the quality of the data is what differentiates a successful AI project from one that will fail. That is why we were interested in finding a way to detect the images with incorrect annotations automatically.
After researching the subject of error detection for image classification projects, we continued to investigate how to find labeling errors for Object Detection projects.
Context of the problem
Contrary to the image classification problem, where we have a single type of error and a clear metric on how good or bad a prediction is (just by taking the probability of the predicted class), for object detection it is not as obvious. The issue is that there are many types of errors. According to Daniel Bolya [1] there are 6 types :
Figure 1: Example of types of errors. Box colors are defined as: 🟥 = false positive detection; 🟨 = ground truth; 🟩 = true positive detection. The IoU with ground truth for each error type is indicated by an orange highlight and shown in the bottom row. tb refers to the background threshold and tf to the class threshold. Source: [1]
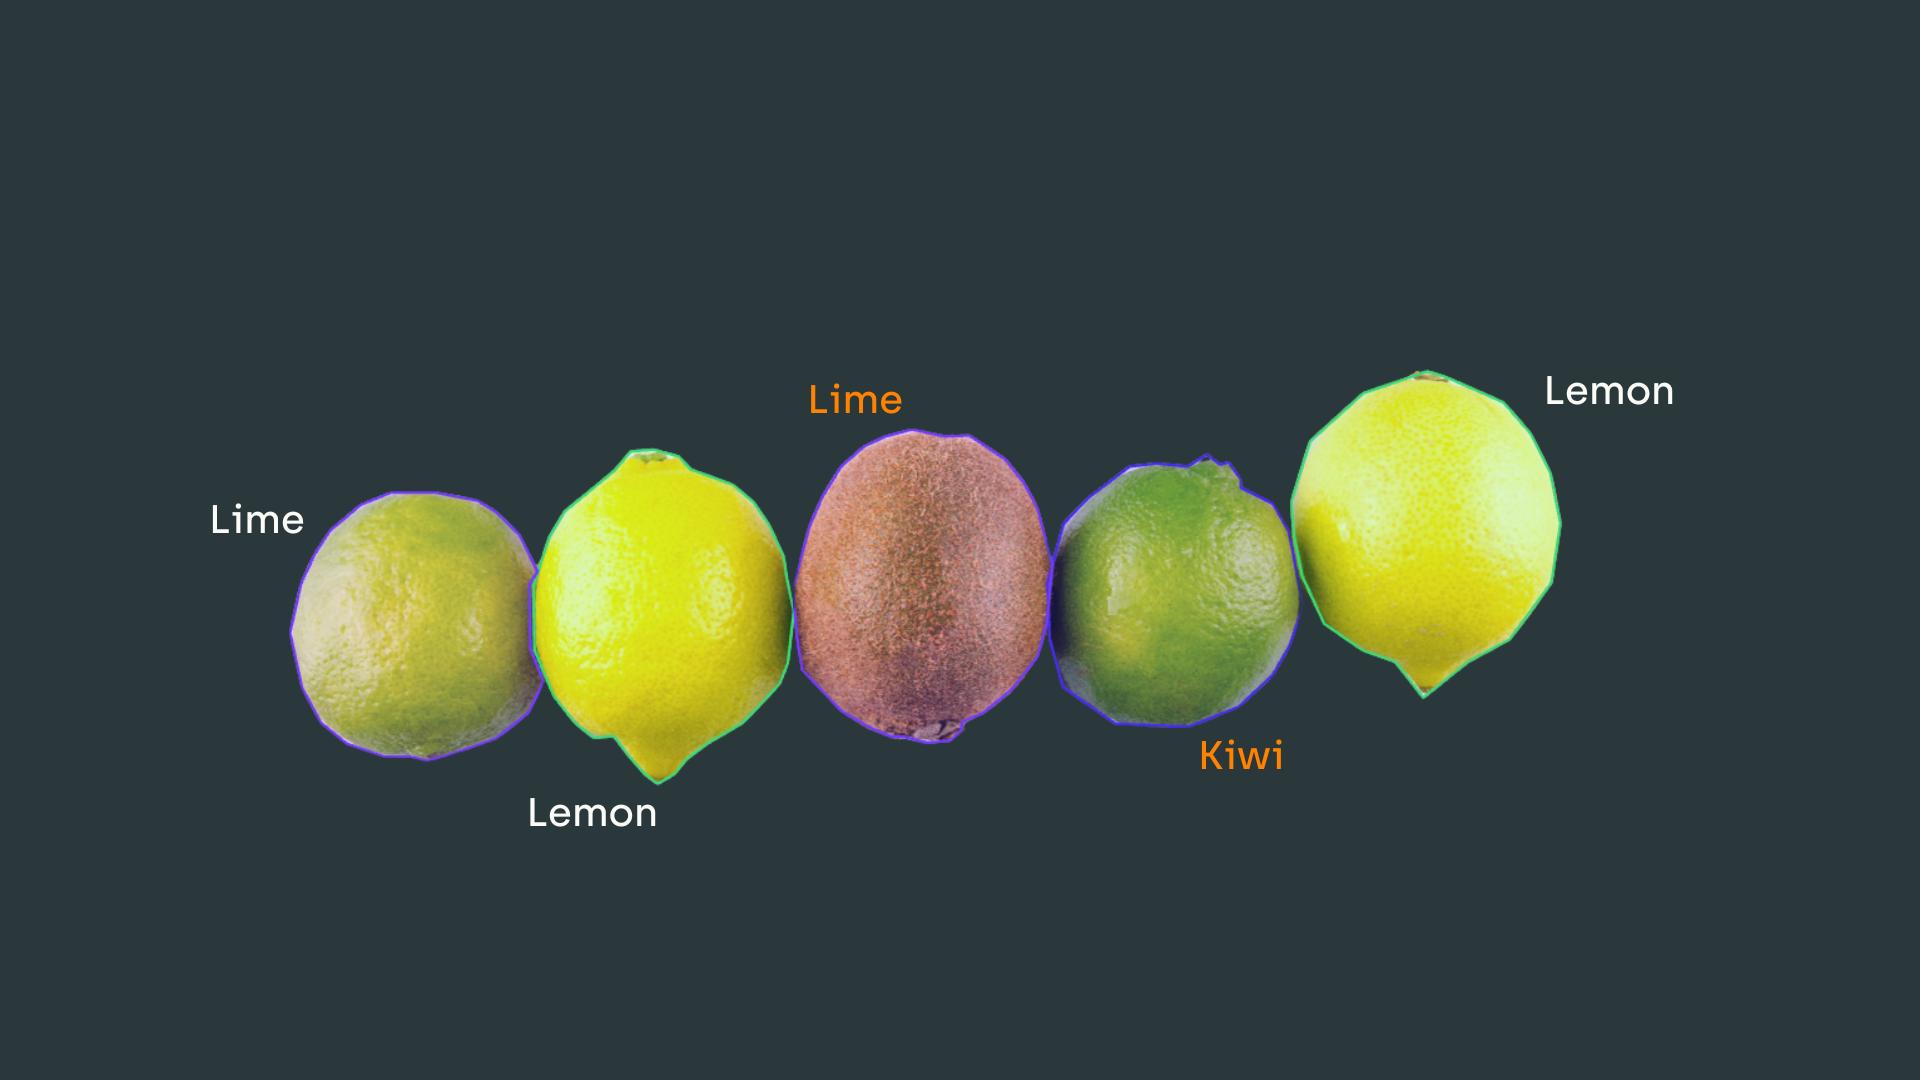
- Classification error: there is sufficient overlap with the ground truth, but the class is wrong
- Localization error: the class of the predicted bounding box is correct, but the overlap is not sufficient (it is too small to be considered as correct)
- Both classification and localization error: there is a prediction that has a small overlap with the ground truth and has the wrong class
- Duplicate detection error: there are two bounding boxes of the correct class that overlap sufficiently with the same ground truth box
- Background error: background is detected as a class
- Missed ground truth error: there are no predictions that overlap with the ground truth box
This makes the approach that we used for classification impossible to use in this case as well. Also, another issue is that we would need the probabilities for all classes, but the current state-of-the-art models provide a single probability for the chosen class since every bounding box is closely tied to a class.
Finally, we did not find research done on the object detection task, and the only solution we found was that of Daniel Bolya [1], that can only classify the types of errors of a set of annotations given the ground truth (for example to see which types of errors does a model produce by comparing its results to the initial data), but in our case, we do not have a given ground truth.
Workflow of the solution
The solution we came up with was to train a neural network using cross-validation, as we did for the classification problem, but this time we would just compare the model prediction with the initial annotation for the entire image. For that purpose, we would calculate a metric of how close the two annotations are based on the comparison and rank all the images according to this metric. Having a very low metric would mean that the annotations are not similar and, thus that there is a higher chance of the original annotation being wrong.
We would then be interested in the images with the lowest values of the metric and we prioritize them for the Review process. Contrary to the solution for classification, we do not identify an exact set of images that are likely to be miss-labeled, but we order all the images with decreasing priority. Once the algorithm is finished, it would be very easy for the reviewer to first see the prioritized images in the Kili platform.
Implementation
We first separate all the images into 4 folds for cross validation. Next, for each fold the model is trained using the YOLOv5 framework with a pre-trained model and by applying transfer learning. Once the training is finished, the model creates predictions and calculates the metric for each image in the test set (the fourth fold that was not used for training and validation).
The most used metric in research currently is COCO mAP (or mean average precision) and it was introduced by the creators of the COCO (Common Objects in Context) dataset. The main criterion for computing this metric is IoU (or Intersection over Union) and it measures the overlap of two bounding boxes :
Figure 2: Image representation of the Intersection over Union
A prediction is considered correct if it has a value of mAP greater than a certain threshold - usually this threshold was 0.5 (for example for the PASCAL VOC metric), but COCO introduced a new metric that calculates the average precision using different thresholds ranging from 0.5 to 0.95 with steps of 0.05 and then returns the average of all these precisions. This is useful to reward models that give predictions closer to the ground truth in terms of localization.
Experiments
In order to test this algorithm, we created a small dataset consisting of 250 images of forklifts, with the forklift being the single object class. We annotated all the images ourselves and for 15 out of 250, we created erroneous annotations, hoping that they will have the lowest metrics in the end and they will be prioritized for review.
Figure 3: Example of images in the created dataset
We then launched our algorithm, which, in the end, updated the priority value of each image in the Kili project. Out of the 17 most prioritized images, 13 were with erroneous labels, which proves that this has indeed helped us to find the errors in our annotated images faster. Thanks to this, the reviewer would not need to look at all the images in the dataset but only at a subset until seeing that the rest of the annotated images are good enough.
Figure 4: The five most prioritized images by the algorithm
Conclusion
This research was the first exploration of the problem, and it gave very promising results, but the biggest problem was the time it took to get results. For the dataset of 250 images, by using Google Colab Pro and thus the best GPUs, the whole process took around 2 hours (training each fold for 100 epochs and taking a pre-trained network yolov5n, which is the smallest network provided by YOLOv5). The main issue is the fact that we use cross-validation and thus, we train the same network four times to get precise results for each fold.
Without taking the time into account, we also need to see how this approach would work when having many classes since we would need to decide if the metric should be calculated as the mean between all classes or if a weighted mean should be used depending on the number of objects of each class.
To conclude, further research is needed to create a solution that would be optimal, and that would be possible to use for all projects. We will continue working on the subject and will try to find a simpler and less time-consuming solution.
References
[1] Daniel Bolya, Sean Foley, James Hays, and Judy Hoffman. Tide: A general toolbox for identifying object detection errors, 2020.
Learn More
For an in-depth understanding of reliable AI, and the role Data-Centric AI has in it, download our ebook and access the 8 key benefits of a data-centric approach to AI
![Best On-Premise Data Labeling Platforms for Regulated Industries [2026] Guide](https://cdn.prod.website-files.com/68da32b2041c593b0511a582/6a574849a90d08dc8b9b547d_Competitor%20Article%20-%20Listicle%201%20(2).webp)