Why focus on data quality?
The phrase "garbage in, garbage out" is highly relevant when producing high-performing models in AI. It underscores the idea that the effectiveness of AI models heavily depends on the quality of the data used to train them. This is where the concept of data-centric AI comes into play. Rather than primarily tinkering with algorithms, data-centric AI emphasizes ensuring data of the highest quality. Doing so can build AI models with a solid foundation for precision, reliability, and efficiency.
Effects of poor data quality
Poor data quality can have significant and far-reaching consequences across various industries and applications. Low-quality data can have a negative impact on both the performance of the model and the overall success of the business.
For example, in the healthcare industry, inaccurate data can lead to misdiagnosis and incorrect treatment recommendations. And in the financial industry, it can result in erroneous financial reports and poor decision-making. Some critical consequences include:
- Reduced Accuracy and Effectiveness of AI Models: AI and machine learning models rely heavily on data quality. Poor data can lead to inaccurate models, resulting in unreliable or incorrect outcomes.
- Increased Costs and Time Delays: Rectifying errors due to low-quality data requires additional resources and time, increasing operational costs and delaying project timelines.
- Decision-Making Challenges: Low-quality data can lead to misguided decisions, as it does not accurately reflect the real-world scenario or problem being analyzed.
- Damaged Reputation and Trust: Organizations relying on data-driven insights can suffer reputational damage if low-quality data leads to poor business decisions that result to public mistakes or failures.
- Compliance and Legal Risks: Inaccurate data can lead to non-compliance with regulations and standards, potentially resulting in legal consequences.
- Lost Opportunities: Data quality issues can lead to missed opportunities for innovation, efficiency, and competitive advantage, as they hinder the ability to gain accurate insights and make informed decisions.
- Label your data with speed and accuracy
- Complete data-labeling task up to 10x faster and with 10x fewer errors. Try out our platform today!
Some examples of the effects of bad-quality data
Let's take a look at some real examples of the effects of bad-quality data in both academic and business reports:
Healthcare
The significance of data quality in AI applications, especially in sensitive sectors like healthcare, cannot be overstated. A study published in Scientific Reports highlights the detrimental impact of poor-quality data on AI performance. In healthcare, data quality issues often arise due to inherent uncertainty or subjectivity, compounded by privacy concerns that restrict access to raw data.
This scenario necessitates innovative approaches to identify and cleanse poor-quality data. This includes mislabeled data, such as an image of a dog incorrectly labeled as a cat. It also encompasses adversarial attacks, where errors are intentionally inserted into data labels, particularly damaging in online machine-learning applications.
The effects of poor-quality data were significant:
- Inaccurate AI Models: Due to poor data quality, AI models in healthcare could be trained on incorrect or noisy information, leading to inaccurate predictions or diagnoses.
- Privacy Concerns: The need to protect patient data often prevents manual verification of data quality, exacerbating the problem.
- Increased Costs and Time for Training: Cleansing poor-quality data requires additional time and resources, increasing the overall cost and duration of AI projects in healthcare.
- Potential for Misdiagnosis: Inaccurate AI models could potentially lead to misdiagnoses or incorrect treatments, having direct adverse effects on patient care and outcomes
Manufacturing
Poor data quality extends beyond healthcare, significantly affecting industries like manufacturing. A McKinsey report highlights how suboptimal data quality is a significant barrier to realizing the full potential of AI in manufacturing. The consequences of accepting low-quality data as inevitable are profound. Many AI projects in manufacturing are delayed or shelved for years due to these data quality issues, leading to a significant loss of potential value. As a result, extensive system redesigns, and data collection efforts involving considerable labor and capital are required to rectify these issues. In one instance, a company's attempt to use AI for detecting failures was hindered by the lack of high-quality, labeled data. The available data, which included communications telemetry and signal measurements, were of low quality and unsuitable for training an effective machine learning model.
How do you measure data quality?
Now that we understand the effects of data quality, the next step would be learning how to ensure quality when we start collecting and building our datasets. How do we measure data quality? In data labeling, we can use the following robust data quality metrics and establish an error-proof data quality strategy to ensure the quality of data.

Consensus
How consensus works at Kili
Consensus refers to the level of agreement among multiple annotators on a specific data labeling task. This metric is especially crucial in scenarios where subjectivity might influence the labeling process. By evaluating the degree of consensus, we can assess the reliability and objectivity of the labeled data. Higher consensus indicates a greater uniformity in interpretation among different annotators, suggesting higher data quality and consistency. This measure is integral in ensuring the accuracy and reliability of labeled datasets, particularly in complex or subjective tasks.
To illustrate, let's use a scenario in a medical image labeling project where annotators are required to identify and label various types of tissue in MRI scans. One particular scan shows a region that is ambiguous—it could be interpreted as either healthy tissue or an early sign of a pathological condition.
In this case, if five expert annotators review the scan, two might label the region as indicative of a pathological condition, while three label it as healthy tissue. This results in a split consensus, reflecting the challenging and subjective nature of the task. The consensus score in this situation would be relatively low, highlighting the need for further review or additional expert opinion to reach a more definitive conclusion.
Honeypot (Gold Standard)

Honeypot refers to a quality control mechanism where tasks with known answers (the honeypots) are interspersed within a set of data labeling tasks. These honeypot tasks are used to monitor and assess the performance of annotators. By comparing the annotators' responses to the known answers to the honeypot tasks, the system can evaluate the accuracy and reliability of the annotators. This method serves as a tool to ensure high-quality data labeling and to identify areas where annotators may need additional training or guidance.
The computation of a honeypot score is typically based on comparing the annotations provided by the annotators with the pre-determined correct answers of the honeypot tasks. This process involves:
- Integration of Honeypot Tasks: Known-answer tasks are mixed into the regular data labeling workflow without the annotators' knowledge.
- Annotator Responses: Annotators complete these tasks along with the regular ones, providing their labels or annotations.
- Comparison and Scoring: Each annotator's responses to the honeypot tasks are compared against the correct answers.
- Calculation of Accuracy: The honeypot score is usually calculated as a percentage, representing the accuracy of the annotator’s responses compared to the known answers of the honeypot tasks.
This score helps assess the annotators' reliability and precision, ensuring the labeled dataset's overall quality.
Intersection over Union (IoU)

Intersection over Union (IoU) is a metric used to evaluate the accuracy of object detection models, primarily in tasks like image segmentation. It quantifies the overlap between the predicted and the actual labeled areas.
To compute IoU:
- Intersection: Determine the area of overlap between the predicted bounding box and the ground truth (actual) bounding box.
- Union: Calculate the total area covered by both the predicted and ground truth bounding boxes.
- IoU Calculation: Divide the intersection area by the union area.
The IoU score ranges from 0 to 1, with 1 indicating a perfect match between the predicted and actual bounding boxes. This metric is crucial for assessing the precision of object detection models.
Labeler vs. Reviewer Scores
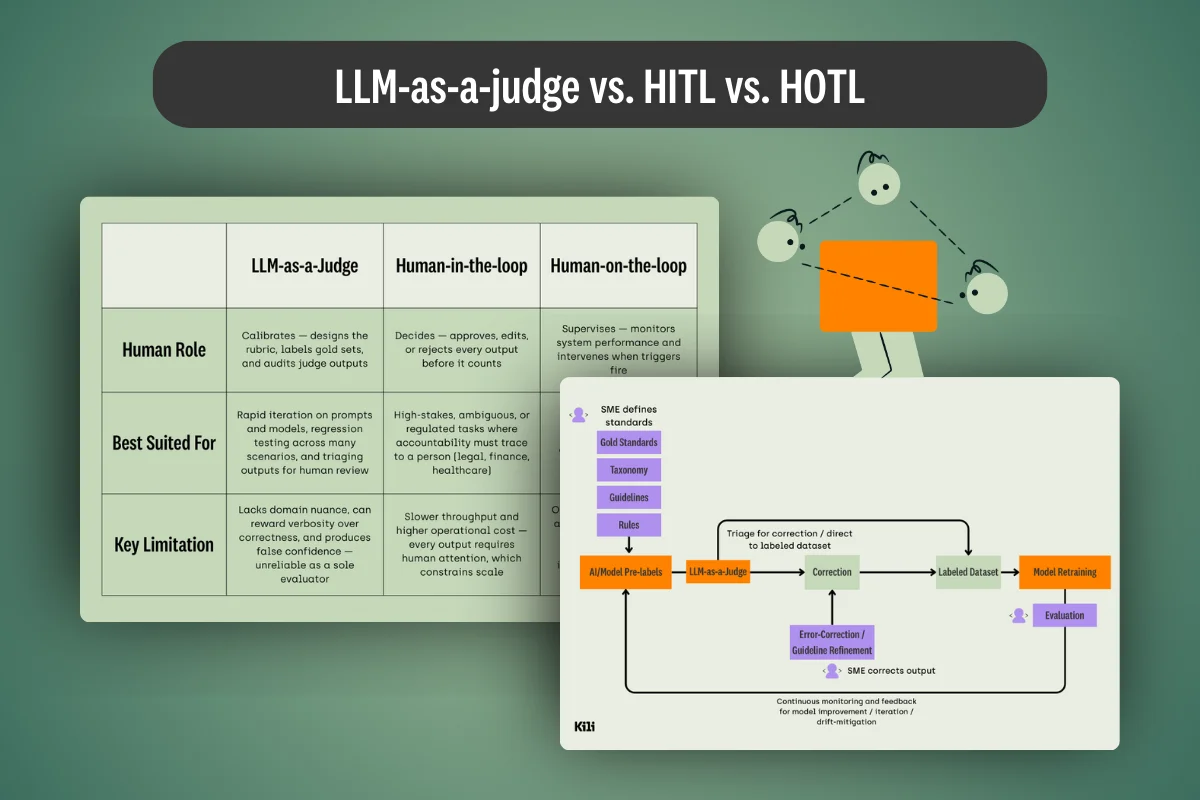
In human-in-the-loop data labeling workflows, review scores are an essential tool for ensuring the accuracy and reliability of the labeled data by incorporating expert feedback into the quality assessment process. This score is calculated by comparing the annotations made by a labeler with those made by a reviewer. For each matching label, a point is awarded, and for each mismatch, a point is subtracted. The review score is then derived by dividing the number of correct labels by the total number of labels reviewed.
Build high-quality datasets to ensure your AI project's optimal performance
The quality of data can make or break your ML model. Kili is here to help reach your model’s fullest potential.
How Kili Technology helps data teams assess data quality
Kili Technology provides a structured and practical approach for data teams to assess and ensure the quality of your data. Beyond the key data quality metrics, Kili provides the ideal data quality tools to create workflows that build high-quality data faster.
Here is an overview of how data teams can utilize Kili Technology's tools and metrics to establish a robust quality workflow:
Continuous feedback collaboration:
Labelers and reviewers are encouraged to collaborate continuously. Labeling instructions can be set to guide the labeling process, and labelers have the option to ask questions through an issues and questions panel for clarifications, which reviewers and managers can then address.
Issue resolution by reviewers and managers:
Reviewers and managers play a crucial role in maintaining quality by creating issues on annotated assets. They can then return these assets to the same or a different labeler for correction. The number of open issues is tracked and visible, ensuring a transparent and responsive correction process.
Focused reviews:

Utilizing the Explore view, reviewers can conduct targeted reviews by filtering the most relevant assets, classes, and labelers. This approach allows for focusing on labels generated recently, new labelers' work, or categories with a high error probability.
Automated Review:

The Review queue automation function in Kili's platform automatically selects assets from the pool of labeled data for review. This selection is random, meaning it does not follow a predetermined pattern or set criteria, which might be influenced by human biases.
Automating the selection process saves significant time and effort that would otherwise be spent manually choosing assets for review. It allows reviewers to focus their energies on the actual review process, improving the overall efficiency of the quality assurance workflow.
Utilization of Quality Metrics:

- Consensus: For simple classification tasks, the consensus metric is used to evaluate the agreement level among labelers. The platform allows setting the percentage of assets covered by consensus and the number of labelers per consensus. Results are accessible in the Explore view and Analytics page.

- Honeypot: To measure the performance of new teams, honeypot tasks (ground truth) are integrated. Honeypot scores are available on the assets Queue page, Explore view, and Analytics page, providing insights into the team’s accuracy.
- Intersection over Union (IoU): IoU is a crucial metric in object detection tasks. It involves applying a matching algorithm to compare the alignment of bounding boxes and the selected classes, and then computing the respective IoU score. This score is further normalized by considering the number of pairs of bounding boxes added, those added exclusively by the reviewer, and those added only by labelers.
Review Score Monitoring:

The review score per labeler is monitored and can be checked in the Quality Insights tab of the Analytics page. Review scores are computed by comparing labeler annotations with expert reviews to quantify annotation quality. These scores are easily accessible through the Quality Insights tab on the Analytics page, providing a user-friendly and transparent way for project managers to assess the performance of each labeler. The aggregation of review scores over time allows for data-driven decision-making.
Project managers can analyze trends and patterns in these scores to make informed decisions about resource allocation, process improvements, and the overall management of the labeling team. They enable project managers to set quality goals and track improvements over time, fostering a culture of continuous improvement within the data labeling team.
Programmatic Quality Assurance (QA):

Watch video
Kili's programmatic QA uses plugins to automate quality checks. Teams can write business rules in Python scripts, which are then used to check new labels automatically. This method efficiently identifies discrepancies, with a QA bot adding issues to assets that don't meet predefined criteria and recalculating accuracy metrics for continuous improvement.
Data teams can create an efficient and effective quality workflow by following these best practices and leveraging Kili Technology's tools. This workflow ensures high-quality labeled data and facilitates continuous improvement and collaboration among team members, ultimately contributing to the success of AI and machine learning projects.
Wrap-up
And there you have it! Poor data quality can have far-reaching consequences, from reduced accuracy and effectiveness of AI models to increased operational costs and time delays. In industries like healthcare and manufacturing, the impact of poor-quality data can be particularly severe, leading to misdiagnoses or delayed AI projects.
The platform's structured approach to data quality assessment allows for the creation of effective workflows that ensure high-quality labeled data and facilitate continuous improvement and collaboration. By leveraging Kili Technology's advanced tools and metrics, teams can avoid the pitfalls of poor data quality, ensuring their AI and machine learning projects are built on a foundation of reliable, accurate, and high-quality data.
Kili Technology offers a comprehensive solution for teams looking to elevate their data quality and harness the full potential of AI. We invite you to book a demo and discover how Kili Technology can help your company build the highest quality data, setting the stage for AI success.
Still, need convincing? Hear from one of our clients how Kili Technology improved their model's performance by efficiently building high-quality datasets.

Watch video

.png)

_logo%201.svg)


